One for the nerds today…
A long long time ago, in economies far far away from where they are today, yield curves moved, a lot. The short end rose and fell, the long end rose and fell, and not so often at the same time and in the same direction. This led to a considerable amount of interest in yield curves from investment banks and the middle iteration of hedge funds for two main reasons. Firstly, yield curves dynamics could, to a non-trivial degree, be captured by mathematical models. Secondly, the global bond market was, and still is, truly huge- more than ten times the size of the global equity market. So, if your model could identify opportunities in bond markets, they could be exploited in very very large size. Often, in the early days at least, very profitably. Hubristically at the time it was known as Fixed Income Arbitrage, however the rather dramatic fall of Long Term Capital Management in 1998 demonstrated is was somewhat less than risk free. Subsequently the area became known by the rather more prosaic Fixed Income Relative Value.
So in the nineties and early to latish naughties, fixed income trading, whether a participant was aware of it or not, was dominated by multi-factor stochastic yield curve models, real interest rates, central bank response functions and output gaps. However, this came to a rather hard end after the crash of ’08. Please note I do say after 08. There were plenty of opportunities during the dislocation, just maybe not so obvious that the risk reward was attractive. The difference however can be encapsulated in the name of one person – Ben Bernanke. Whether by design or luck, of one sort or another, the head of the Federal Reserve at the time of biggest crisis since 1929 was in fact a great student of the crash of ‘29. He knew well that one of the issues that made ’29 worse than it might have been, was the Fed action of the raising of rates in the midst of the crisis. In his own words – “Regarding the Great Depression, … we did it. We’re very sorry. … We won’t do it again…”. And they did not. The Fed slashed rates to close to zero, massively increased liquidity in the system and when they decided that was not enough tried to further increase liquidity and decrease longer dated yields by purchasing long dated bonds. This game plan was pretty much followed by all central banks at the time except for Japan. Japan is the outlier as it had been running this game-plan since the mid-nineties to no appreciable success. But maybe they were not just doing it right. The intelligence of the plan however was demonstrated by the ECB who tried raising rates in 2011, which prompted the Eurozone crisis, which scared them so much that rates are still negative in Europe, ten years later.
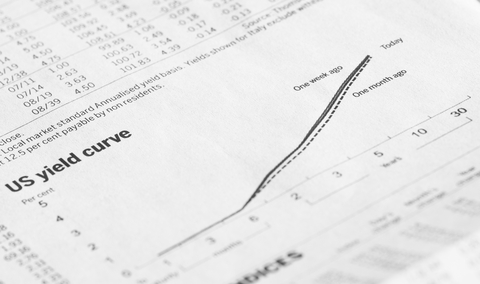
Anyhoo, all this central bank intervention meant that yield curve dynamics got dull. If short term rates were stuck close to zero forever and long-term rates controlled by intervention, there was not a lot of chance on anything interesting happing in any given curve. Until today that is. The shape of the US, EUR and JPY yield curves today are what is known as “normal”. That is, they start low and then rise so that long term rates are generally higher than short term rates. There is a bit of a roll-over at the ultra-long end due to stochastic effects, but it is not that particularly relevant here. Yield curves are normal when short term rates, normally driven by central bank utility, are lower than long term rates, normally driven by inflation expectations. In a normal yield curve, the expectation of interest rates is that they will rise slowly to reduce expected future inflation, over the long term, and that some sort of dynamic equilibrium between interest rates and inflation expectations is reached. Except in the UK. In the UK the yield curve is what is known as inverted. That is 2yr rates are higher than 10yr rates and in the last ten years this is unusual. In fact, the last time this happened was in 2008 and we all know how that turned out.
So what is the problem? In a nutshell it is that the market is saying that the central bank has sort of lost what normally passes for their control of the economy. That can be more than disconcerting. According to its yield curve, in the UK short term rates are forecast to rise until some point in 2023 they are forecast to fall, fast. Why, the yield curve does not say as it does not have the language skills, but it is unlikely to be good news. The market adage is that yield curves predicted six out of the last five recessions. Not perfect, but not bad either. What is clear however is that after ten years slumbering under the warm blanket of overwhelming central bank intervention, global bond markets look like they are starting to get interesting again.
The UK looks like it is raising rates, the US looks certain to start tapering and even the ECB is starting to talk brave (obviously not acting brave). The last time we saw an inverted yield curve, rates were 400 – 500 bps higher. Currently if yield curves become very interesting, there is only limited room on the upside and vast swathes of downside. This might come to nothing but it is a cautionary tale from the UK canary in the global bond coalmine.


Get in touch
Please contact us if you would like to learn more about our solutions